WorkspaceManager_Pnl-CompiledObjectDebuggerCompiled Object Debugger_AD
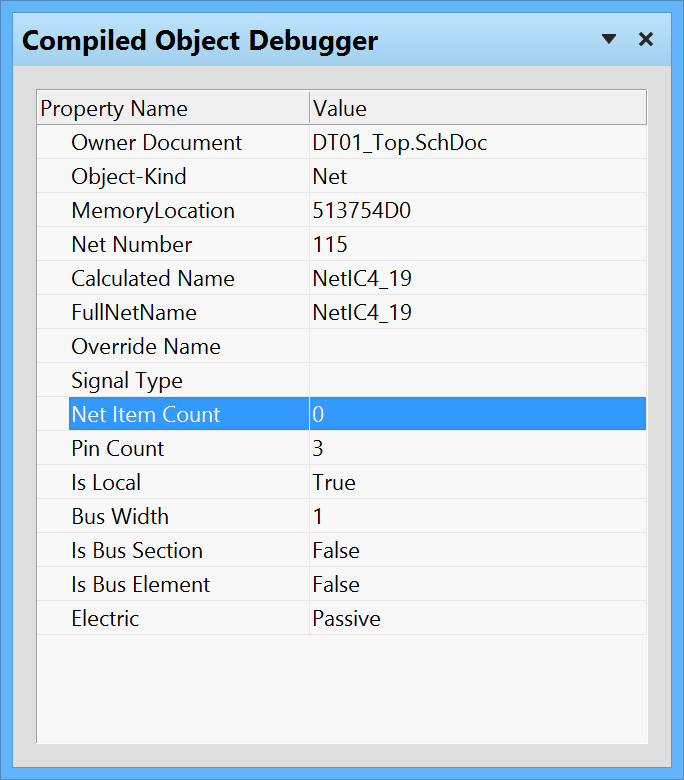
View specific object error information with the Compiled Object Debugger panel.
Summary
The Compiled Object Debugger panel enables you to view detailed information about an object or document selected in the Navigator panel or an error selected in the Messages panel.
Panel Access
To open the panel, click the Design Compiler button at the bottom-right of the editor window then select the Compiled Object Debugger entry from the pop-up menu.

The panel can also be accessed by clicking View » Workspace Panels » Design Compiler » Compiled Object Debugger.
Debugging Compile Errors
As you click on any entry in the Navigator panel, information related specifically to that object (or document at the highest level) will be displayed in the Compiled Object Debugger panel. When you click on an entry in the Messages panel, detailed information with respect to the error will appear in the Compiled Object Debugger panel, which is helpful when investigating the cause of the violation.
Click on the offending object associated with an error in the Messages panel will display information specific to that object in the Compiled Object Debugger panel.
Note that information displayed in the Compiled Object Debugger panel is read-only.


