Parent page: Workspace Projects
The Enterprise Server Workspace project view provides design data comparison features that allow you to compare data changes that have occurred between different project releases and/or commits. Particularly valuable for performing final checks prior to sending your product data to the manufacturing side, the features allow you to determine exactly what changes have occurred in your Gerber, Schematic, and BOM data between release/commit events.
Gerber Comparison
Making a final check of your fabricated board data prior to sending out to the manufacturer is always a good thing. The Gerber comparison feature facilitates just that, with the ability to quickly check to ensure no differences in your fabrication output between released iterations of your design project. It provides a purely graphical, layer-by-layer comparison, highlighting areas with changes using a bounding box and a number.
The Gerber comparison feature can be accessed by:
- Clicking the
 button associated with a specific release of a project in the Releases view of the detailed management page for that project. Choose the Gerber to option and which other release's fabrication data to compare against.
- Clicking the
 button at the top-right of the Manufacturing Portal browser tab, when viewing a specific release package for a project. Choose the Gerber to option and which other release's fabrication data to compare against.
- Clicking the
 control at the top-right of a Project Released event tile in the History view of the detailed management page for the project and choosing the Gerber to option. Compare against the previous release's fabrication data, select from all possible releases.
Once the comparison release has been chosen, the results of the comparison are presented in the Gerber Compare view, which opens in a separate browser tab.
Depending on the number of differences that exist, it can take a while to generate the comparison data. You can either wait or close the
Gerber Compare view – if
email notifications are enabled, an email will be sent to you once the data is ready to view. Click the

button in the email to access the
Gerber Compare view again.

Example comparison of the generated Gerber data between release fabrication data packages.
By default, the Compare tab of the view is presented to instantly view the differences between the two sets of Gerber data. Color coding is used to distinguish the older Gerber data (Red) from the new Gerber data (Green). Select the upper view tabs to switch the Gerber data view for either of the compared sets as required – the view switches to standard Gerber viewing mode, keeping the location and zoom level the same.
Each detected difference is numbered and outlined. Click on an entry in the left-hand pane to focus on that specific difference in the main viewing area.
If you click on a layer that has no differences, you will be alerted to that fact in the main viewing window.
Browsing Controls
Browsing controls for the main viewing area are as follows:
- Mouse wheel forward/backward to zoom in/out.
- Click & hold (or right-click & hold), then drag to pan document.
Taking Measurements
You can freely measure between any two points within the view without any snapping guidance whatsoever. To do so click the  button. The Measurements pane opens, the cursor changes to a cross-hair, and you will enter measurement mode.
Measurement is performed as follows:
- Position the cursor to where you wish to start measuring (Point 1) and click. The point is marked using a small white cross.
-
Move the cursor to the required end point (Point 2) and click again. As you move the cursor, a measuring line is displayed as an aide, showing the current XY distance (from Point 1 to the end of the line).
Right-click before defining Point 2 to start afresh – ready to define Point 1 again.
-
The Measurements pane reports the XY distance measured, the X (horizontal) distance, and the Y (vertical) distance.
Measurement units will initially be those used for the design itself but can be switched between metric (mm) and imperial (mil) from the
Info pane of the interface (accessed by clicking

in the top-right control cluster).
- Continue measuring the distance between other points, or click the
 button again (or Esc) to exit measurement mode.
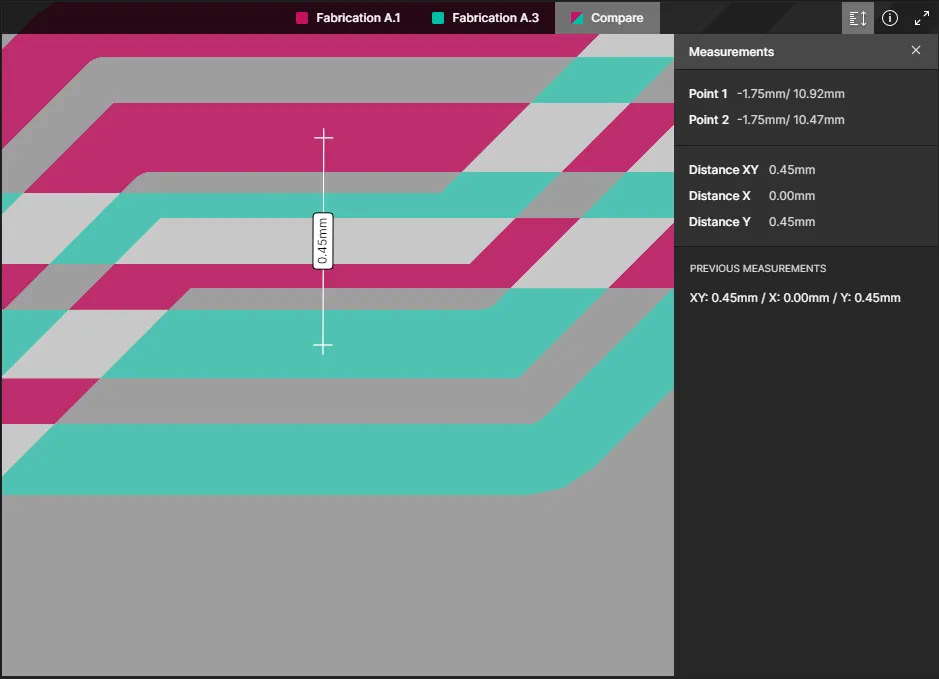
Example measurement taken on the Compare view of the Gerber data.
The last five measurements are listed in the Previous Measurements region of the Measurements pane. The most recent is at the top of the list. Click on an entry to retrieve that measurement – both in the pane and graphically in the main viewing area.
Measurements are available during the current session of the page only. If you refresh the browser tab, the previous measurements will be cleared.
Schematic Comparison
Along with the comparison of Gerber data (see above), the project view also provides the ability to compare project schematic documents in a simple interactive interface. This offers a quick and convenient way to see only what changes have occurred between schematic iterations.
The Schematic Comparison feature presents differences graphically and as parametric data, which are listed in an associated Compare pane that allows cross-probing to the related schematic object(s). A comparison can be invoked between project Releases, project Commits, or between project Commits and Releases (available from the History view).
The Schematic comparison feature can be accessed by:
- Clicking the
 button associated with a specific release of a project in the Releases view of the detailed management page for that project. Choose the Schematic to option and which other release's source data to compare against.
- Clicking the
 button at the top-right of the Manufacturing Portal browser tab, when viewing a specific release package for a project. Choose the Schematic to option and which other release's source data to compare against.
- Clicking the
 control at the top-right of a Project Committed or Project Released event tile in the History view of the detailed management page for the project and choosing the Schematic to option. Schematic data from the last release/commit can be selected (Previous Release or Previous Commit), or the data from any Commit/Release event by choosing the Select Commit or Release option – select the target comparison event by clicking on its tile.
When the comparison Commit/Release pair has been selected, the results of that comparison are opened as the Schematic differences view in a new browser tab. The first schematic in the source documents is presented by default, and the logical differences found (changed Component and Net data) for all schematics presented as a selectable list in the associated Differences pane. Note that purely graphical changes, such as a moved component, are not included at this time.
Depending on the number of differences that exist, it can take a while to generate the comparison data. You can either wait or close the
Schematic Compare view – if
email notifications are enabled, an email will be sent to you once the data is ready to view. Click the

button in the email to access the
Schematic Compare view again.
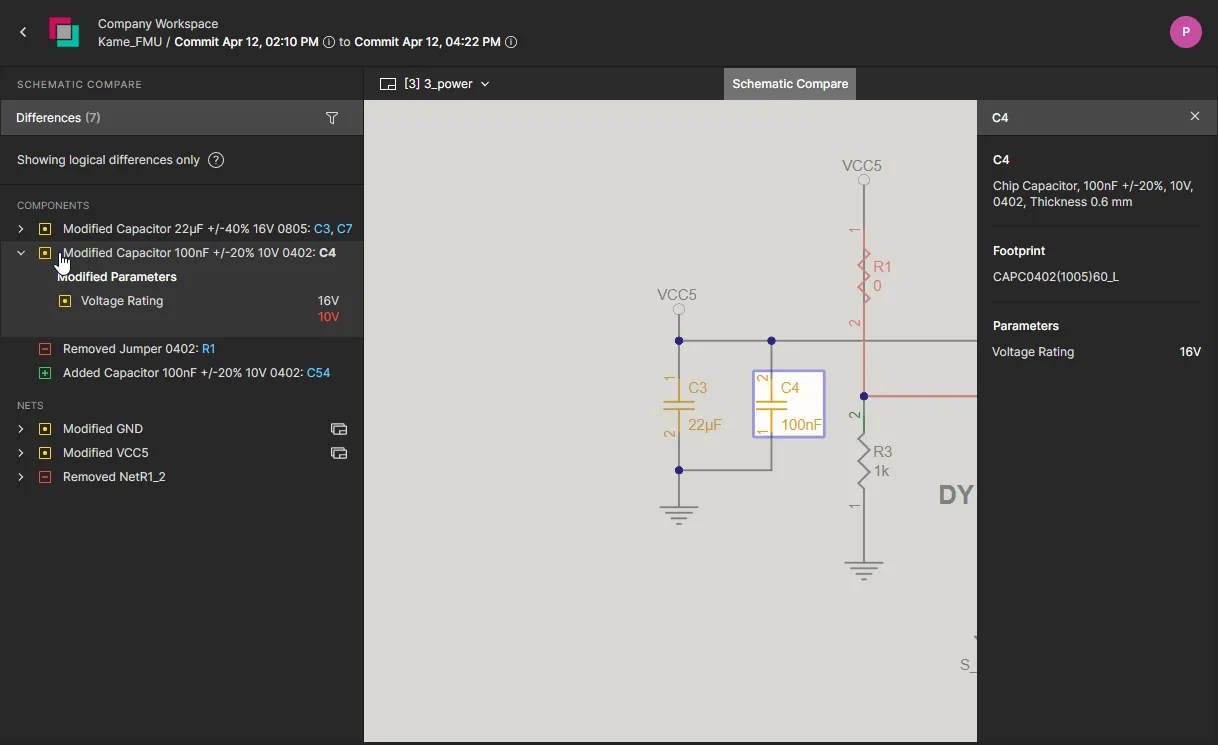
Select an item in the Compare list to expose its parametric information and cross-probe to its symbol in the associated schematic document.
Hover the cursor over the comparison data names at the top of the window to see the name of the user who created each Commit/Release, and any attached notes.
Select a listed element in the Compare pane to expose any available change details and cross probe to its schematic graphic. Each element in the list has an associated icon indicating its general change status – red: removed, green: added, yellow/orange: modified. The same coding is used in the cross-probed schematic graphics.
The pane's differences list is grouped by Components and Nets:
- Components – Each entry includes the names of affected components, and when selected, expands a list of any changed component parameters (highlighted in red) and unchanged parameters (green). Select the RefDes of a component included in the entry (highlighted in blue) to cross probe to its schematic graphic.
- Nets – Each entry includes the names of any components affected by a net modification, or conversely, the name of components that caused a net modification. Select a Net entry in the pane to cross probe to the entire net on the active schematic, or a RefDes included in the entry to focus on that net component.
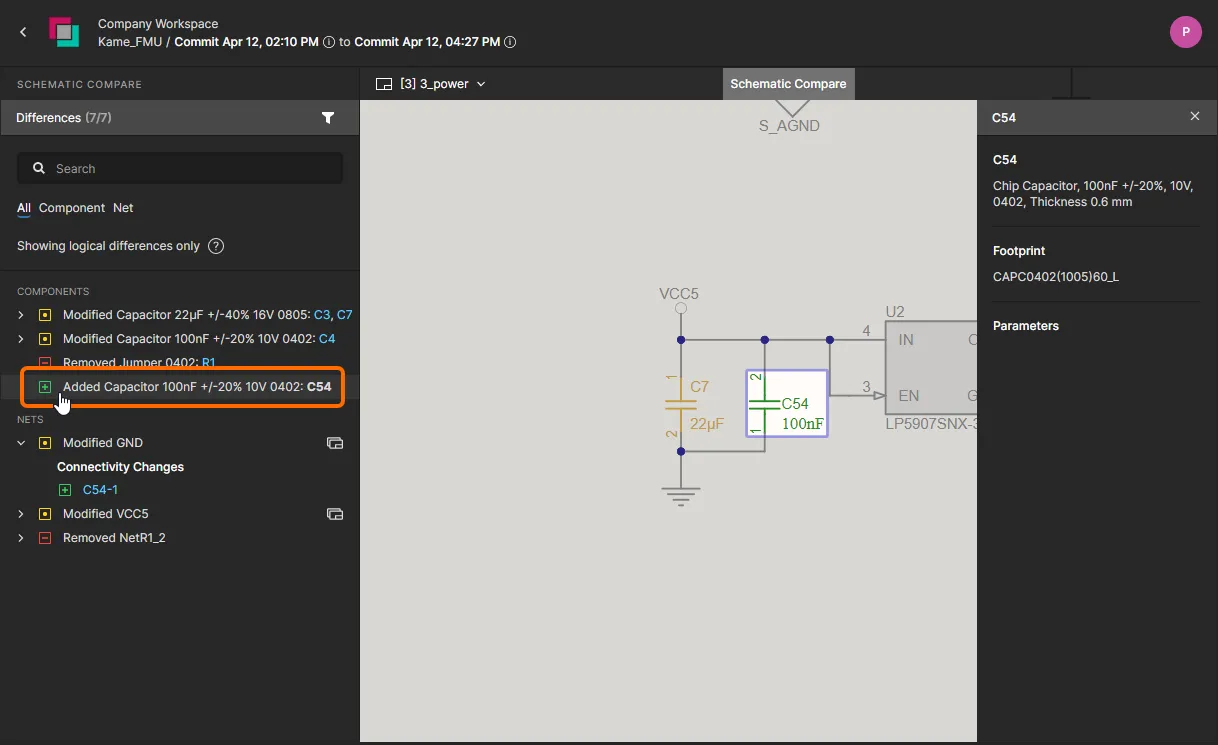
Select a Component or Net entry in the Compare pane to cross-probe to its highlighted graphic representation in the schematic document.
Use the pane's listing filter ( ) to constrain the entries by a specified string or category.

A  icon associated with a Net entry in the Compare pane indicates the presence of that net in other schematic documents. Select the icon to access a drop-down list of those schematic documents, where each document affected by the net change is indicated by yellow highlighting. Choose a schematic document from the menu to cross-probe to the net on that schematic, which is highlighted accordingly.
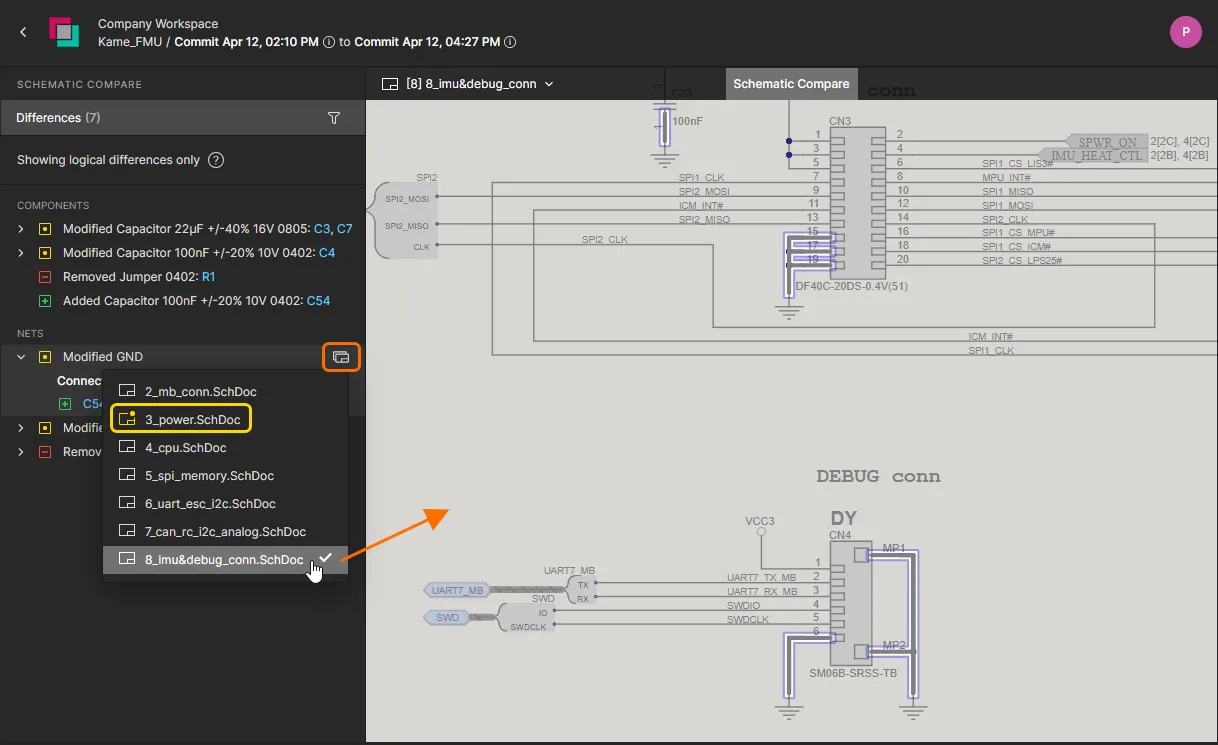
The entry for a modified Net includes a link to other schematic documents that also include the Net.
BOM Comparison
The project view also provides a quick BOM Comparison feature to detect and show any design component data changes that have occurred between commit and/or release iterations. The differences are reported in text (CSV) form and made available as a local download.
The BOM Compare feature requires that the Commit or Release events being compared include an
ActiveBOM document.
The BOM Comparison feature can be accessed by:
- Clicking the
 button associated with a specific release of a project in the Releases view of the detailed management page for that project. Choose the BOM to option and which other release's source data to compare against.
- Clicking the
 button at the top-right of the Manufacturing Portal browser tab when viewing a specific release package for a project. Choose the BOM to option and which other release's source data to compare against.
- Clicking the
 control at the top-right of a Project Committed or Project Released event tile in the History view of the detailed management page for the project and choosing the BOM to option. BOM data from the last release/commit can be selected (Previous Release or Previous Commit), or the data from any Commit/Release event by choosing the Select Commit or Release option – select the target comparison event by clicking on its tile.
The system will compare the BOM data between the specified project Releases or Commits, and then open the results of that comparison as the BOM differences view in a new browser tab. This view is populated with a list of color-coded entries that represent BOM items that have changed between the specified BOM events. Additional information and control is provided by the BOM Compare pane on the left, which allows you to choose an alternative design Variant, or select/deselect the inclusion of component change categories (Added, Removed, Modified).
Depending on the number of differences that exist, it can take a while to generate the comparison data. You can either wait or close the
BOM Compare view – if
email notifications are enabled, an email will be sent to you once the data is ready to view. Click the

button in the email to access the
BOM Compare view again.
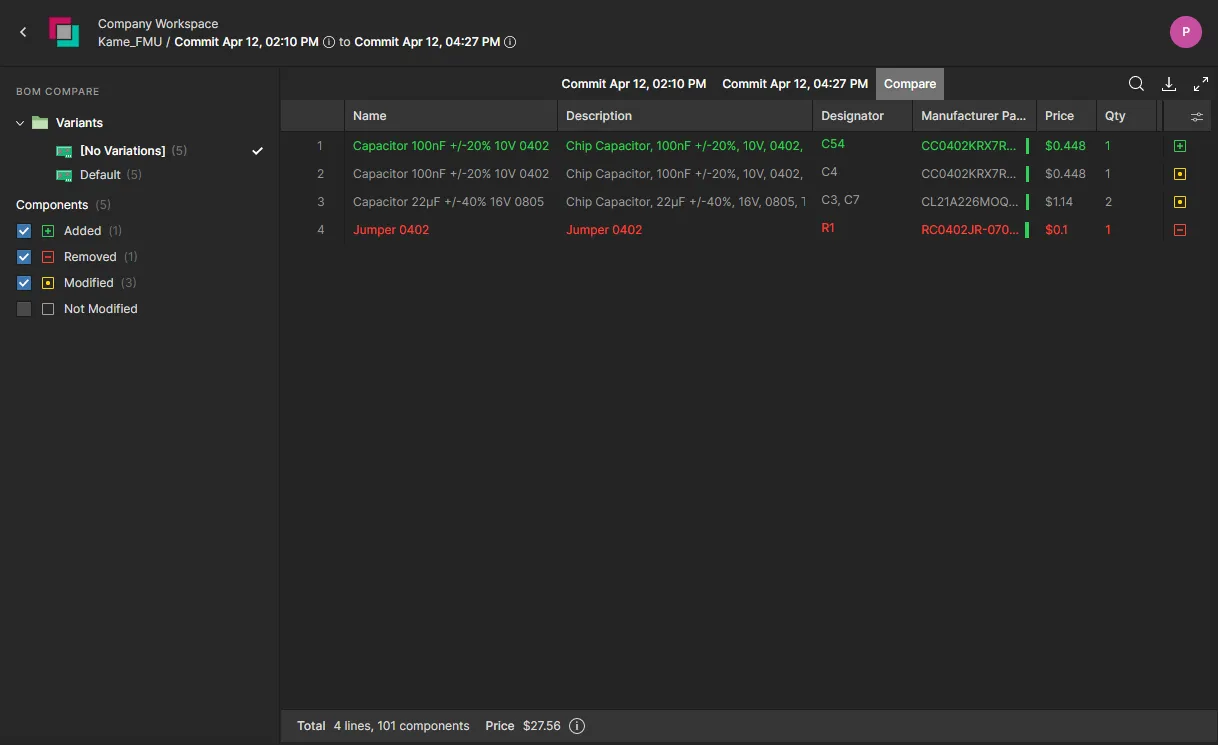
The initial BOM Compare view includes entries representing the differences between the source and target BOM documents.
-
Hover the cursor over the icon associated with a BOM compare entry to see a summary of the changes that have occurred.

-
Use the Column Settings menu ( ) to enable or disable the inclusion of specific component parameter data columns.

BOM entries that have not changed can be included in the listing by checking the Not Modified option in the Compare pane, or to see the raw BOM listings that have been specified for the comparison, select their individual tabs available at the top of the comparison listing.
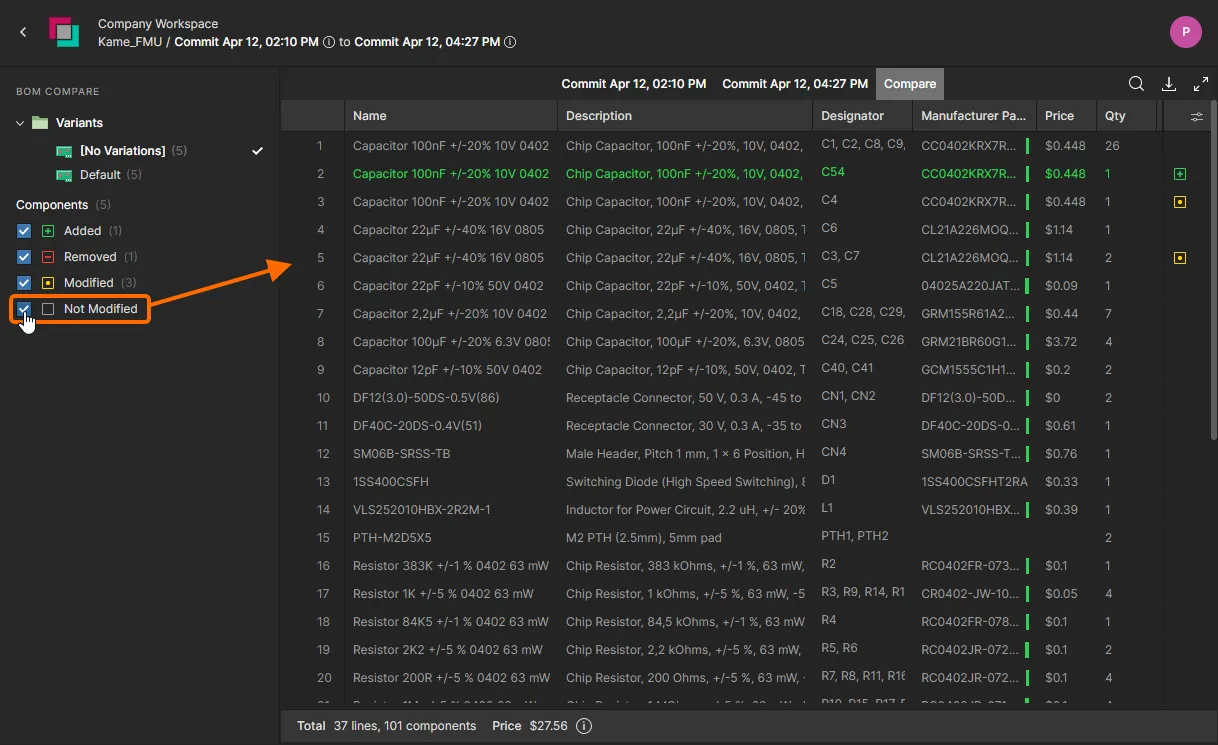
Use the Not Modified option to include unchanged entries in the listing, or select a BOM document tab to see the full source/target BOM document listing.
Invoked from the download option ( ), the comparison engine will also generate a summary of any updates in a standard CSV format. The BOM comparison summary is generated for the currently selected Variant of the design, and includes details of BOM data that has changed – been updated – between the specified project releases/commits.

The downloaded BOM comparison CSV files show data that has been updated between the project releases specified when invoking the compare feature.
