Monitoring the Health of Altium On-Prem Enterprise Server
The Enterprise Server includes a comprehensive health monitoring system that allows Administrators to quickly ascertain and analyze the condition, or ‘health’ of an Enterprise Server. The health monitor is available from the Admin section of the Workspace browser interface (the Server Health page), or as a standalone executable tool that is included in the Enterprise Server installation on its host PC (the Server Health Monitor tool).
The health feature delivers a visual summary of the state of the Enterprise Server's configuration and services, information on the host machine's system resources, and also provides access to status reports and log files. This provides an immediate overview of the Enterprise Server's status, which allows administrators to preemptively detect and resolve any issues that may affect Workspace users.
Each approach to monitoring the Enterprise Server's health and status has its own distinct advantage:
- Server Health page – as part of the Enterprise Server Workspace browser interface the Server Health page is available to administrators over the local network, which offers the convenience of remote access.
-
Server Health Monitor tool – the standalone Health Monitor executable (
avhealth.exe) is accessible regardless of the state of the Enterprise Server, and will therefore provide crucial data and information in the unlikely event that the Enterprise Server is not fully functioning.
Server Health page
Within the Workspace's browser interface, select Admin – Health in the main menu to access the Server Health reporter page, which will indicate the overall status of the Enterprise Server installation at the time stamp reference shown in the top Status section of the page (Updated at: <timestamp>).

The Server Health page provides an instant view of the Enterprise Server's status and that of its support infrastructure.
As well as the quick visual summary of the server's health, the page also provides the following functionality:
-
Ability to generate a status report for sending to Altium's Support (and ultimately Altium's Developers). To do so, click on the Generate part of the Generate status report for support team text, in the Status area of the page – the necessary reports will be generated and collated in a single Zip archive (vault_status_report_<Date>.zip) and downloaded to your browser's default download folder.
-
Ability to download all log files – containing Error and Warning entries from all of the server’s available Log files, and which are normally located in the
\ProgramData\Altium\Altium365Data\logsfolder. To do so click the Download all logs link, in the Logs section of the page. The files will be collated into a single Zip archive (AllLogs.zip) and downloaded to your browser's default download folder. -
Use the Clear logs link (located at the bottom of the Logs section of the page) to archive, then delete all existing log files. The archive (logs_<Date>.zip) will be stored in the
\ProgramData\Altium\Altium365Data\logs.archivefolder. -
The Server Health page information is periodically updated (as indicated by the Status time stamp), but an update may be triggered on demand. To manually refresh the status of your server, click the refresh status link, in the Status area of the page. The health of your server and system will be checked and the page refreshed with the current state accordingly. The date and time reflect the last time the server health was checked.
 Click the refresh link to update the Enterprise Server health information.
Errors and Warnings
As a highlighted overview of the Enterprise Server status, the Server Health page provides distinct warning/error icons and associated descriptions for status entries of concern. Common alerts include overdue data backups, pending license expiries, an active admin/admin user account, or detected error entries in a log file:
-
OK
 – the detected metrics are within an acceptable range or condition.
-
Warning
 – the Enterprise Server and its supporting infrastructure is functioning correctly, but a change is recommended to resolve a potential or future issue.
-
Error
 – part of the Enterprise Server or its supporting infrastructure is not functioning or configured correctly and requires immediate attention.
Correcting Common Issues
While any Performance and System issues are likely to be addressed by improving the Enterprise Server host PC's available resources and infrastructure, problems in the Environment and configuration section of the Server Health page can generally be resolved using the features and tools available to Workspace administrators:
-
Admin password – create one or more specific administrator accounts in the Users page, if you have not already done so, and change the Password (and preferably the Username) of the default
adminaccount. -
Log level – if required, change the Enterprise Server logging level by editing the
LogLevel=entry in the General section of theLocalVault.inifile, located in the Enterprise Server's installation folder on the host PC. The permitted level entries areInfo(the default) andWarn. With the latter option, general status information (API calls, starting and stopping of services, etc) will not be included in the log files – errors are always included. -
Licenses – a pending Enterprise Server license expiry error is addressed through the Licenses page of the browser interface (Admin – Licenses). An already expired license can be resolved by accessing the browser interface of the on the Enterprise Server host machine.
-
Backups – a Workspace backup can be completed using the
avbackup.exetool, available in theTools\BackupToolfolder within the Enterprise Server installation on the host PC.
Reports and Logs
The performance of both the Enterprise Server and host PC are tested and summarized (in the Performance and System sections), and report logs made available for generation and download:
- Logs – Enterprise Server Logs download as a zip archive to the browser's default download location (Download all logs). These include plain text logs for all services hosted by the Enterprise Server, where the log file for each service includes time-based events (and errors) since the Enterprise Server was installed, or the logs cleared (Clear logs).
- Reports – the Enterprise Server Status Report downloads as a zip archive to the browser's default download location (invoked by the Generate link in the top Status section of the page). This reports the condition status and setup of all core Enterprise Server elements. Intended as key information for Altium support teams, the reports also include status and performance information on the host PC's supporting infrastructure.
Health Monitor tool
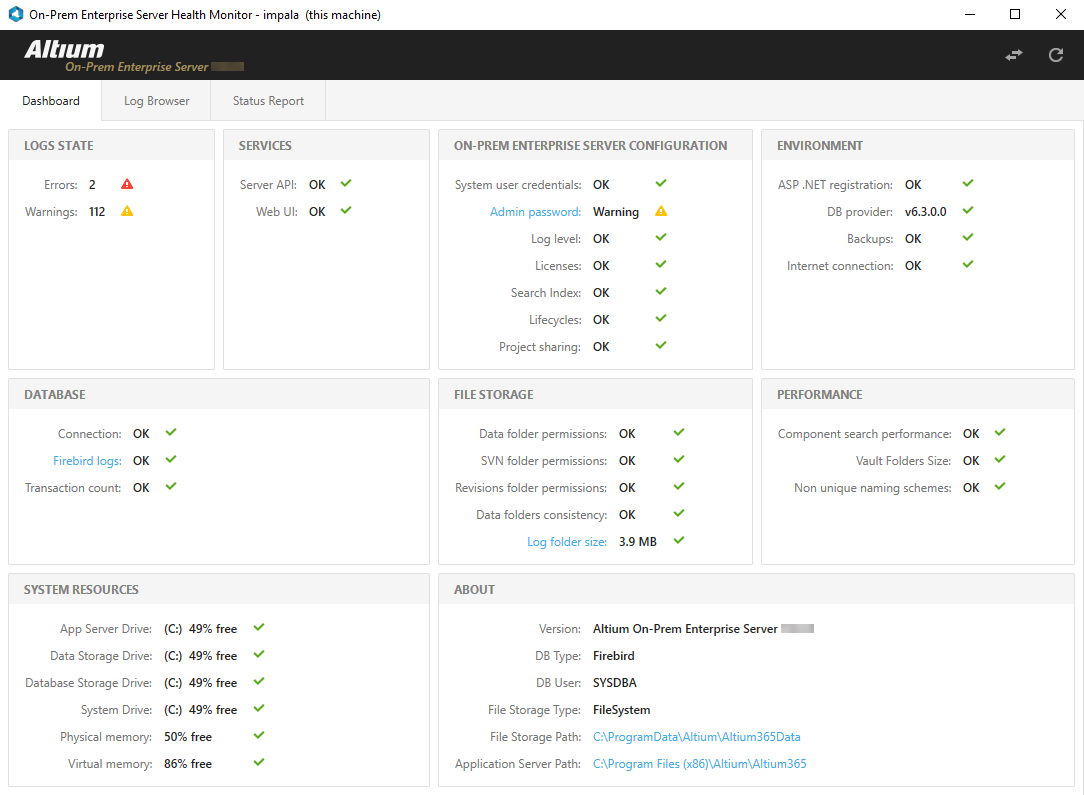
The Enterprise Server installation includes the comprehensive On-Prem Enterprise Server Health Monitor tool that allows Administrators to quickly ascertain and analyze the condition, or ‘health’ of the Enterprise Server at a local level. Provided as a stand-alone, independent application with the Enterprise Server's installation, the Health Monitor delivers a visual summary of the state of the host machine, and the Enterprise Server's configuration and services. Its interface also includes context-related hints, plus information and paths to important locations and log files.
The Health Monitor presents Enterprise Server status information via a simple GUI, and in general terms, covers the following critical areas:
- Enterprise Server Environment – the state of the host PC’s hardware, such as its hard disks, memory, CPU and the adequacy of its performance.
- Enterprise Server Backend – the state of the Enterprise Server’s supporting database, file storage and repository.
- Enterprise Server Services – the state the Enterprise Server’s range of services, hosted as IIS Application Pools, such as the Identity, Authorization, License Manager and Network Installation services.
Tool Access
In a default installation of the Enterprise Server, the Health Monitor tool can be found in the \Program Files (x86)\Altium\Altium365\Tools\HealthMonitor folder as the avhealth.exe executable. Note that the folder also includes a simplified command-line tool: avConsoleHealth.exe.
When the GUI Health Monitor tool (avhealth.exe) is run, the program immediately interrogates the Enterprise Server and its hosting systems to populate the main Health Monitor Dashboard screen – as selected (by default) in the upper tabs. Click the Refresh button to retrigger the process and update the screen.

The Health Monitor Dashboard GUI provides an instant view of the Enterprise Server's status and that of its support infrastructure, plus links to more information.
Errors and Warnings
The status of each item in the Dashboard is indicated by a message and associated icon:
-
OK
 – the detected metrics are within an acceptable range or condition.
-
Warning
 – the Enterprise Server and its supporting infrastructure is functioning correctly, but a change is recommended to resolve a potential or future issue.
-
Error
 – part of the Enterprise Server or its supporting infrastructure is not functioning correctly and requires immediate attention.
Hover the mouse over an item’s status for more information. For an Error or Warning that is shown in the Dashboard, further details are (in most cases) available by clicking the status entry for that item.

Hover over a status entry to access more detailed information.
Responsive links
Many of the Error/Warning conditions detected by the Health Monitor offer links intended to help resolve the situation. These are included in the item’s detailed information, available when clicking on its status entry.


Where common event issues occur, the associated information provides further details and links to help resolve the condition of concern.
In the above example screen on the left, the Health Monitor has detected that the Enterprise Server has not been backed up. The associated information provides a link to documentation that will help to resolve the situation.
The example screen on the right (above) indicates that the Enterprise Server's default admin/admin sign-in credentials still exist, which poses a significant security risk. The Fix It link in the associated information directly accesses the Enterprise Server's sign-in page through the browser interface, where the Administrator User profiles can be corrected.
Log Browser
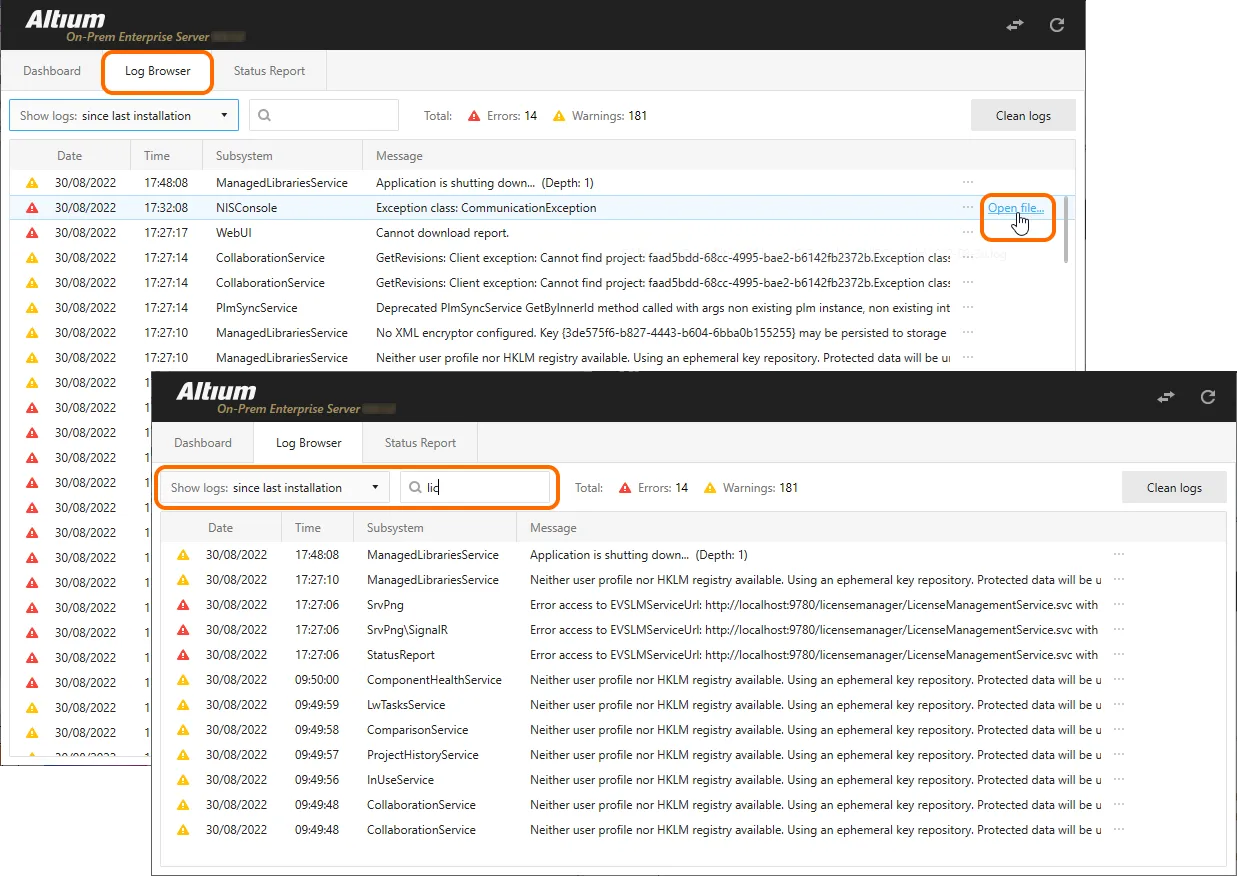
The Health Monitor’s Log Browser screen, accessed by the Log Browser tab, presents Error and Warning entries from all of the Enterprise Server’s available Log files – normally located in the C:\ProgramData\Altium\Altium365Data\logs folder. To view the log file that contains the event entry, select the associated Open file link or simply double-click on the entry itself.
The cumulative event entries in the list are sectioned by date and will include all available Error/Warning events that are available from all log files. To find specific events, choose a time period from the Show logs drop-down menu, and/or use the dynamic filter field to search for keywords within the Subsystem and Message columns.

The Log Browser interface allows you to zero in on events of interest using a selectable time period and keyword filtering.
Select the ![]() button to remove the accumulated log entries from the Log Browser list – this will archive then delete all existing log files.
button to remove the accumulated log entries from the Log Browser list – this will archive then delete all existing log files.
Status Report
The Health Monitor’s Status Report screen, accessed by the Status Report tab, is used to create and display Enterprise Server status report files. The generated reports collate all the event debug information in a single Zip archive (*.zip) that can be sent, when necessary, to Altium Developers.
To create a report, select an appropriate event time period from the Include Logs drop-down menu, enter your contact details and select the sharing agreement, and then initiate the process with the ![]() button.
button.

Use the Status Report screen to generate collated Log report files for debugging purposes.
