When required analyses are configured and run, analysis results are written to a Simulation Data File (SDF), which is named after the project itself (<ProjectName>.sdf) and appears in the Projects panel under the Generated\Simulation Documents folder. The file automatically opened as a document tab – presented in the SimData editor. This feature-rich environment allows you to quickly and efficiently analyze simulation results, enabling you to assess, debug and ultimately emerge confident in the operation of your design. Note that although created, this file is initially unsaved.
Working with the List of Simulation Results
Performed simulation runs are displayed in the Results region of the Simulation Dashboard panel. The  button at the right of a specific result entry offers the following actions:
-
Show Results – reopen the results from that run. You can also double-click a result name to reopen it.
-
Load Profile – restore the analysis settings from that run in the corresponding region of the Simulation Dashboard panel's Analysis Setup & Run region.
-
Edit Title – rename the result entry. By default, a result is named after the analysis.
-
Edit Description – edit the description of the result entry. By default, a description reflects the key parameters of the run. You can also click the description field to edit it.
-
Delete – delete the result entry.

Use the Results region of the Simulation Dashboard panel to manage simulation results.
You also can toggle the lock icon ( /
/ ) associated with a simulation result entry to preserve the results of that run, where a subsequent analysis run of that type will be renamed with an incremented number suffix. Simulation result locking allows you to accumulate the results from multiple runs of the same analysis type.
A Simulation Data File can essentially be broken down into three constituent parts:
A chart can be thought of as a 'page' in the SDF file. An SDF file can contain multiple charts, the content of each depending on the type of analysis being performed. A plot is an area used to display data graphically and can be used to display one or more waveforms. A chart can contain multiple plots. A waveform represents analysis data collected from a specific point or node in a design.
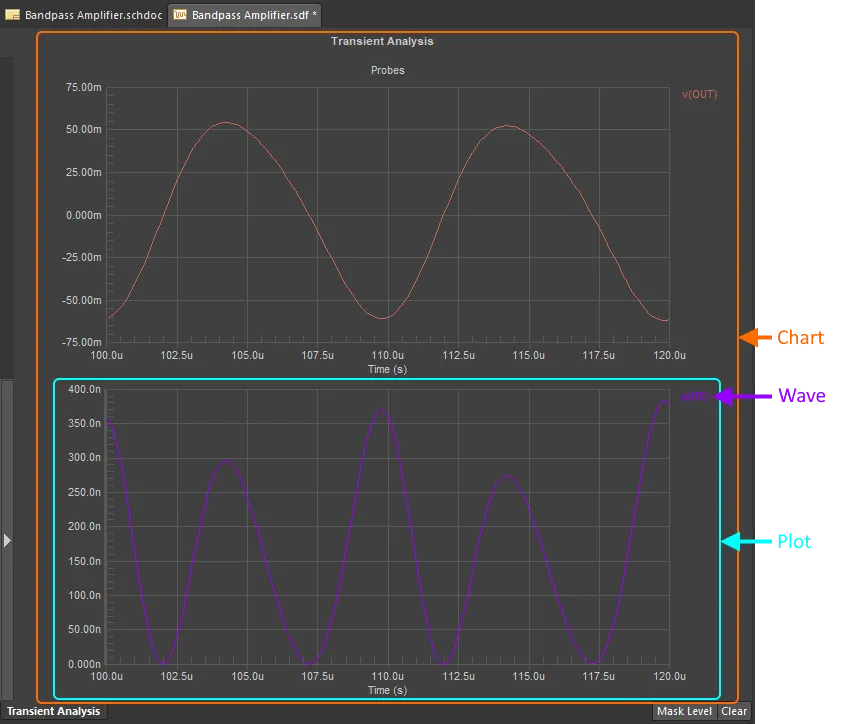
Understanding the different elements in the simulation results
When running a simulation, a separate chart will be created for each analysis type. The chart for an analysis type is accessed by clicking on its named tab at the bottom of the design space. Quickly flick through multiple charts of analysis results using the + and - keys on the numeric keypad.
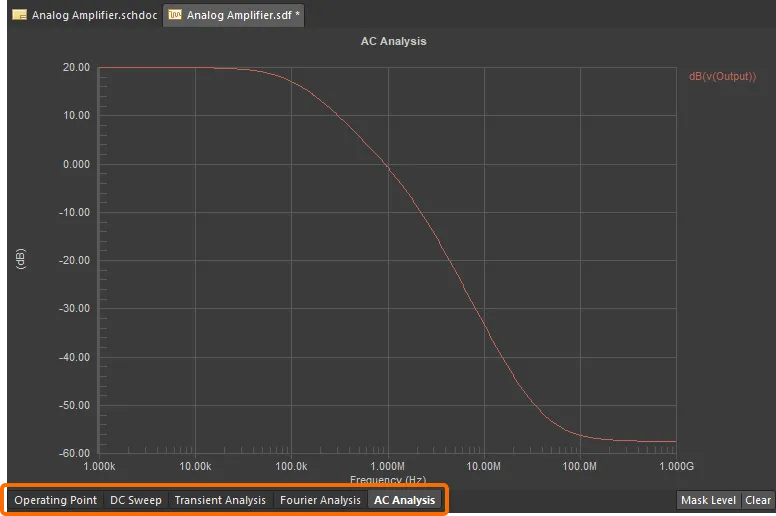
Accessing simulation analysis results. Click on the relevant tab to see the results for that analysis type.
For analyses that result in waveform data, the number of plots contained in a chart will depend on the analysis type, the probes added to the schematics and the output expressions added when configuring the analysis type.
The charts created for certain simulation analysis types will not contain plots and/or waveforms. For example, the chart for an Operating Point analysis displays textual data. The chart for a Pole-Zero analysis contains a single plot, but graphical pole (X) and zero (0) entries rather than waveforms in the typical 'analog wave' sense.
Quick tips for working in the SimData editor:
-
A wave can be moved from one plot to another by clicking and holding the waveform name, then dragging it to a different plot.
-
To display an existing wave on a new, separate plot, double-click on the name, then select
New Plot in the Plot Number drop-down in the Edit Waveform dialog.
-
To zoom in to examine an area of a plot, left-click-and-drag a rectangle to define the new view area. To restore the view, right-click and select Fit Document.
-
Double-click anywhere within a plot to open the Plot Options dialog, where you can configure the Title, Grid Lines, and Line Style.
-
Double-click on an axis to label and configure that axis.
-
Double-click on the chart title to open the Chart Options dialog, where you can name the chart and also configure which cursor measurements are displayed on that plot, if the cursors are currently enabled.
-
Select Tools » Document Options from the menu to open the Document Options dialog, where you can configure the colors, the visibility of various wave, chart and plot elements (including the data points), and define the FFT length.
Selecting a Waveform
Selection of a waveform within the design space is a case of clicking on the waveform's name. Once selected, the waveform will become bolder in color and have a dot to the left of its name. Filtering is applied, using the name of the waveform as the scope. All other waveforms in the active chart with different names will be masked (becoming dimmed).
-
If more than one waveform of the same name exists in the active chart, the non-selected instances will remain at full visibility.
-
Select multiple waveforms using the Shift+Click shortcut. This might be useful to compare some waveforms in a waveform-dense plot.
The extent of the masking can be controlled through the use of the Mask Level slider bar, accessed by clicking the Mask Level button located at the bottom-right of the design space.

Select a waveform by clicking on its name and set the mask level using the button and slider at the bottom right.
To clear filtering and return to the full visibility of all plots, click the Clear button located at the bottom-right of the design space or use the Wave » Clear Filter command from the main menus (shortcuts: Esc, Shift+C). The previously selected waveform, on whose name the scope of the applied filter was based, will become deselected.
If a plot includes a considerable number of waveforms, the plot will include a scroll feature. Click on the available button(s) to scroll through all waveform names included in the plot.
Displaying Multi-pass Results
Temperature Sweep, Parameter Sweep, and Monte Carlo analysis are simulation features that perform multiple passes of a basic analysis type (e.g., AC Sweep, Transient, etc), varying one or more circuit parameters with each pass. When the results are displayed within the SimData editor, the associated plot contains waveforms for multiple passes, and each pass is identified by adding a letter and a number after the waveform name (e.g., v(Output) p1, v(Output) p2, etc.). The letter is used to signify the type of multi-pass analysis:
-
t – Temperature Sweep
-
p – Parameter Sweep
-
m – Monte Carlo
The number signifies the actual pass.
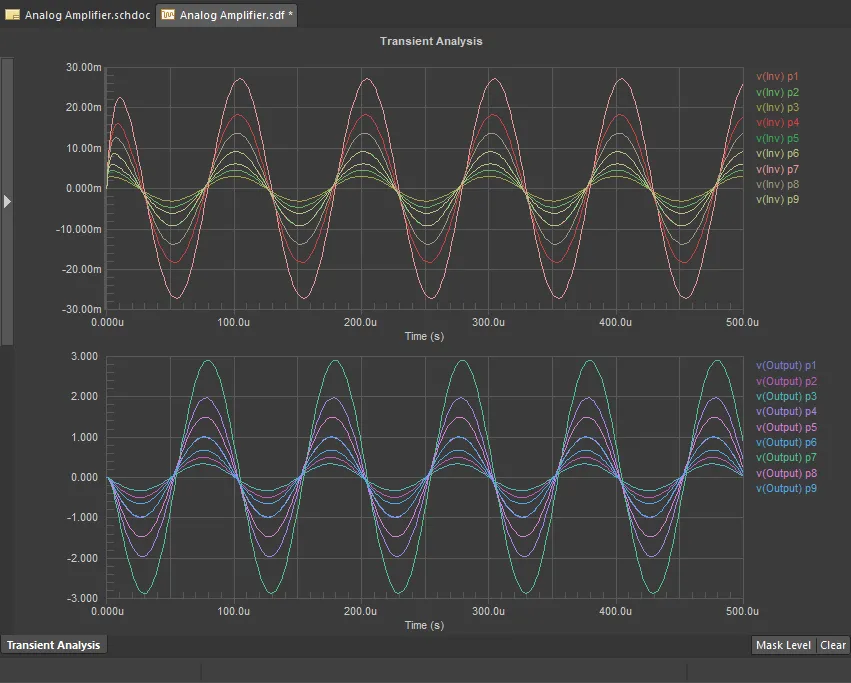
Example results of a Parameter Sweep analysis
As you click on the waveform name, information on the parameter(s) used in that particular pass will appear underneath the plot and in the Status bar. Also, the other waveforms corresponding to the same parameter values are highlighted when the Highlight Similar Waves option is enabled in the Document Options dialog (Tools » Document Options).

Click a waveform for a specific pass to see its parameters and highlight other waveforms related to the same pass.
Controlling the Number of Visible Plots
When analysis results are first written to an SDF file, they are, by default, displayed in an optimum way – displaying between one and four plots in view at a time, depending on the number of plots resulting from the analysis. For example, if there are three plots, the chart will be configured automatically to display all three plots in view. If there were six plots, the chart would be automatically configured to display four plots in view at a time, and so on. You can change how many plots are 'visible' by configuring the Number of Plots Visible option in the Document Options dialog accessed for the active SDF file by choosing Tools » Document Options from the main menus.
The settings defined in the Document Options dialog can be applied to the active chart only, all charts in the current SDF file, and/or saved as the default options – which will be applied to all subsequently generated charts. Use the drop-down at the bottom left of the dialog to choose a desired option.
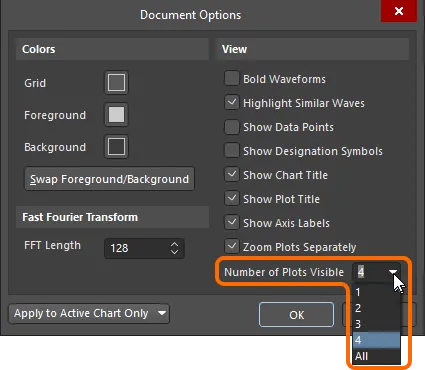
Select the required Number of Plots Visible in the Document Options dialog.
By setting the number of plots visible to All, you will typically be able to see all plots at once within the design space (dependent, of course, on the number of plots resulting from the analysis). This is considered to be a 'draft mode' – providing a quick overview of the generated waveforms.
When you want to analyze the waveforms in more detail, you should move from viewing all plots, to a specific number of them. The lower the number of plots visible in the design space at any one time, the easier it will be to concentrate on a particular waveform and take measurements from it. If you want to take advantage of resizing features (X- and/ or Y-axes), addition of Y-axes and plot labeling, you will need to set the Number of Plots Visible option to anything but All.
Rearranging Plots and Waveforms
You can change the order in which plots appear in a chart by clicking and dragging. First, ensure that the plot you wish to move is made active in the design space. When the Number of Plots Visible is set to All, the active plot is distinguished by a solid line around its waveform name section; if the Number of Plots Visible is set to 2, 3, or 4, the active plot is distinguished by an arrow at the left-hand side of its display area. Then click inside the waveform name area (away from the name itself) and drag up or down as required. A line will appear to indicate under which plot the plot you are moving will be placed if you release the mouse button.
Just as plots can be moved, waveforms themselves can be moved between plots. Click on a waveform name and drag it to the required destination plot. An arrow will appear at the top of the Y-axis for the recipient plot. Movement can be performed irrespective of the number of visible plots.
A waveform can also be moved to a new plot by double-clicking on the waveform's name, then selecting New Plot in the Plot Number drop-down in the Edit Waveform dialog that opens. After doing this, you may need to change the number of visible plots, this is done in the Document Options dialog (Tools » Document Options).
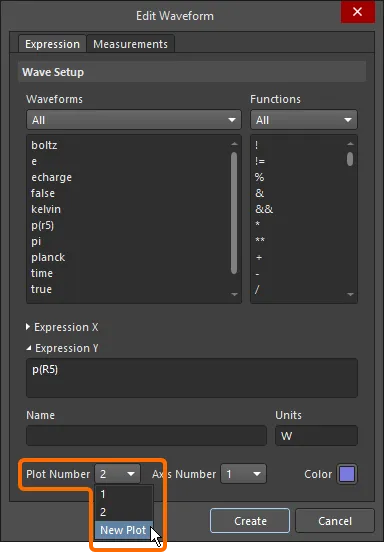
Move a waveform to a new plot using the Edit Waveform dialog.
The video below demonstrates the process of rearranging plots and waveforms.
Demonstration of the plot and waveform rearrangement techniques.
-
Multiple selected waveforms (selected in the same or different plots using the Shift+Click shortcut) can also be moved to another plot using drag-and-drop.
-
You may need to adjust the Y-axis after the move to better 'fit' the waveforms. This is especially true if the destination waveform is larger in amplitude than the waveform in the target plot. For more information on adjustment of plot axes, see the Changing the Axis section.
Magnifying the Data
You can change the magnification of the active plot, allowing you to zoom in or out when analyzing waveform data. Use the dedicated Zoom In and Zoom Out commands from the View main menu to zoom in or zoom out, respectively. Alternatively, click and drag a selection square about a point of interest to magnify (zoom in) to that point.
When changing the magnification of the data in one plot, the other plots will not be changed. Disable the Zoom Plots Separately option in the Document Options dialog to apply the same level of magnification to all plots when changing the magnification of the data in one plot.
-
To zoom relative to the mouse pointer position using the Zoom In and Zoom Out commands, position the pointer and launch the command using its keyboard shortcut – PgUp for zoom-in and PgDn for zoom-out.
-
Use the Z keyboard shortcut to access a pop-up menu of zoom commands:
-
Zoom All – zoom to all waveforms in the current chart in their entirety.
-
Zoom In – bring the waveform(s) closer to you (zoom in) relative to the center positions of each associated wave plot in the active chart.
-
Zoom Out – move the waveform(s) away from you (zoom out) relative to the center positions of each associated wave plot in the chart.
To return to the initial display of the waveforms (non-magnified), run the Fit Document command from the main View menu or from the design space right-click menu (shortcut: Ctrl+PgDn).
The video below demonstrates the process of magnifying the simulation result data.
Demonstration of the magnifying data techniques.
Defining Multiple Y-axes for a Plot
There may be times where a single Y-axis will just not work. For example, you may be wanting to contrast current and voltage signals in a common plot. The voltage signal might run to 5V, whereas the current signal may be in the order of milliamps or microamps. To make the waveforms 'readable' the SimData editor provides for the use of additional Y-axes.
Consider the waveforms shown in the image below. One shows the input voltage and the other shows the current through a resistor. If the current waveform is now moved into the same plot as the voltage waveform, you can see that the current waveform is basically lost when scaled using the existing Y-axis for the plot. A better approach is to define a new Y-axis, giving the result shown below.
A new Y-axis can be added for the current waveform in one of the following ways:
-
Right-click on its name, choose Edit Wave, and in the Edit Waveform dialog that appears, select New Axis from the Axis Number drop-down.

Set a new Y-axis for a waveform using the Edit Waveform dialog.
-
Add a new Y-axis (Plot » Add Y Axis), then drag the current waveform onto the axis to create association.
The new (automatically scaled) Y-axis for the waveform will be added to the left of the existing Y-axis. The result is easily readable waveforms in a single plot.
To remove a Y-axis from a plot that has multiple Y-axes defined for it, click on the axis to select it and run the Plot » Remove Y Axis command. Alternatively, right-click on the axis and choose Delete Axis from the context menu.
Deleting a Y-axis will also delete the waveform associated to it. Of course, the waveform can always be added back into a plot from the Source Data region of the Sim Data panel. If you want to remove the axis without removing the waveform, however, you need to disassociate it from the axis. Click on the waveform's name and drag it onto the Y-axis that will remain. You can then go ahead and safely remove the redundant Y-axis.
Displaying Data Points
If you are unsure about the accuracy of the waveforms – perhaps they look sharp and jagged instead of smooth and curved – you can enable the display of data points, to check if the results have been calculated often enough.
To display these points, enable the Show Data Points option in the Document Options dialog. A small circle will be displayed at each point along the wave at which data was calculated.
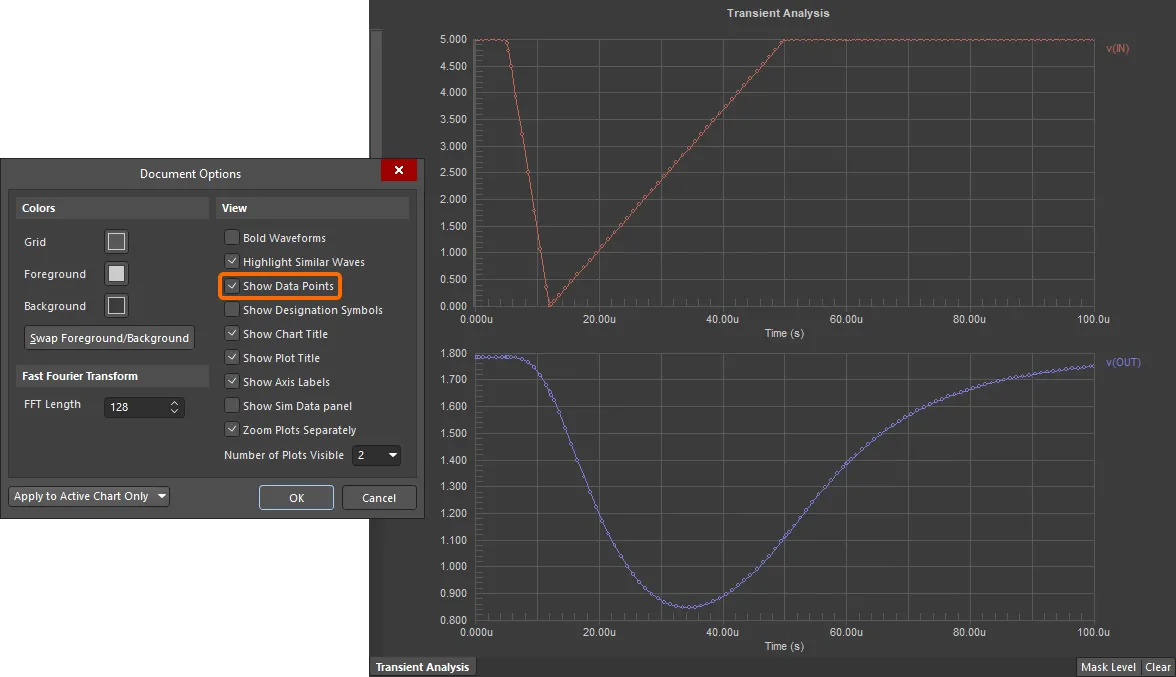
Use the Show Data Points option to visualize the accuracy of the waveforms.
Fast Fourier Transform
By using the Chart » Create FFT Chart command, you can quickly perform a Fast Fourier Transform on each waveform in the active chart. The results are stored in, and displayed on, a new chart, which is named using the format <SourceChartName>_FFT and added to the right of the existing charts in the SDF file.
Set the FFT Length in the Document Options dialog (Tools » Document Options). By default, the length is 128.
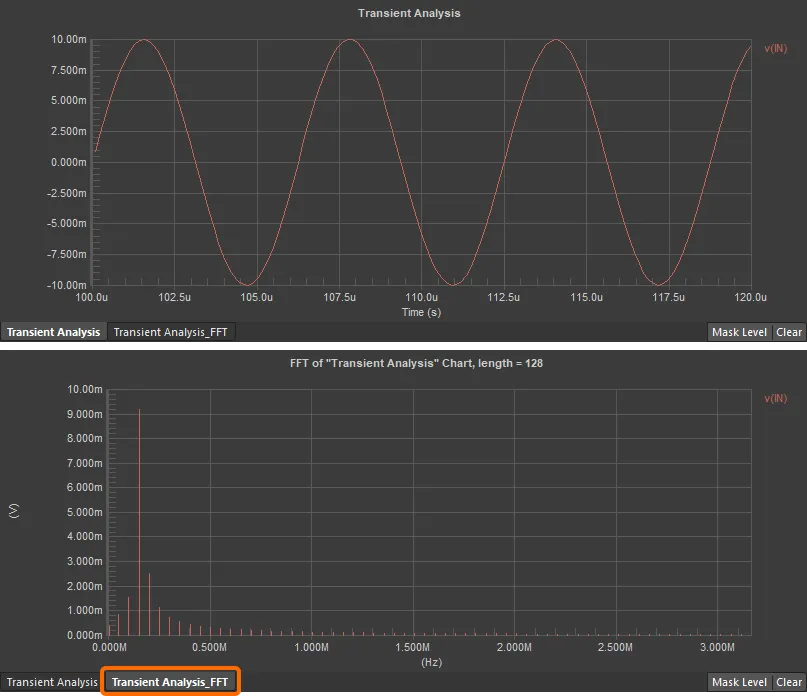
Use the Create FFT Chart command to perform a Fast Fourier Transform.
Other Features for Chart, Plot and Waveform Management
Refer to the sections below to learn about other features for chart, plot and waveform management.
Changing the Axis
The waveforms are automatically scaled when they are first displayed. The X-axis will be scaled in accordance with the setting for the particular analysis type. The Y-axis of each plot is scaled such that all waveforms in the chart are fully visible.
The X- or Y-axis can be changed from the X Axis Settings or Y Axis Settings dialog, respectively. To access the dialog for the axis of the active plot, select the Plot » Format X Axis / Plot » Format Y Axis command from the main menus or double-click the required axis.
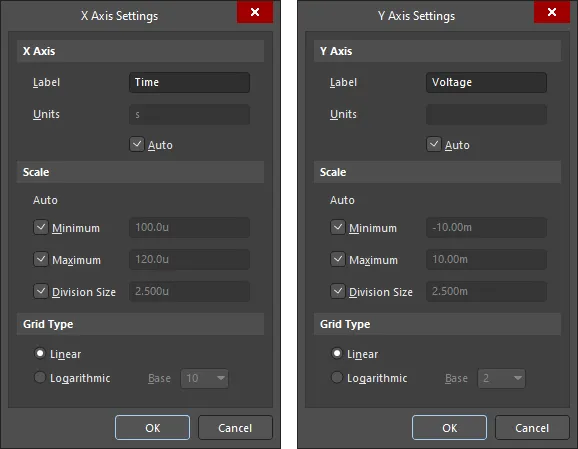
The X Axis Settings and Y Axis Settings dialogs
The X Axis / Y Axis region of the dialog allows you to add a label to the axis and specify units for it.
In the Scale region of the dialog, uncheck the checkboxes if you want to apply your own, manual scaling. Use the Minimum and Maximum fields to change the extents of the axis. Change the Division Size to define the number of grid lines for the axis.
Use of the Grid Type options in the dialog to change the axis to Linear or Logarithmic (base 2 or base 10).
To quickly display all waveforms in their entirety, use the View » Fit Document command (shortcut: Ctrl+PgDn).
The axes cannot be changed when the chart is configured to display All plots.
Adding New Charts and Plots
There may be occasions where you want to apply mathematical functions to waveforms, arrange the plots in a certain order, change the scaling of axes, or display custom-created waveforms. If you perform any of these on an existing (automatically generated) chart for an analysis, that information will be lost when you run a subsequent analysis. In such cases, you may prefer to create one or more new charts.
Create a new chart using the Chart » New Chart command from the main menus. The Create New Chart dialog will appear. Use the dialog to define a name (which appears on its tab) and title for the chart. The Cursors tab allows you to determine what data gets presented on the chart itself when using measurement cursors. These options can be defined before the chart's creation, or at a later stage by accessing the Chart Options dialog (Chart » Chart Options).
You can determine the cursor measurements to be displayed under the parent plot through options available on the Chart Options dialog's Cursors tab If one or both cursors have been added to a waveform.

The General and Cursors tabs of the Create New Chart dialog
The new chart will be added, with its tab inserted to the right of the existing chart tabs.

Empty plots can also be added to a chart using the Edit » Insert command. Where plots already exist, using this command will insert a new plot above the active plot.
A newly created chart is blank by default, so you will want to populate it. The fastest way to do this would be to copy existing plots from another chart and paste them into the new chart (see next section). You can, however, create new plots from scratch.
Plot creation is performed using the Plot Wizard. Access to this wizard is made by running the Plot » New Plot command from the main menus or by right-clicking within the chart and choosing Add Plot. Follow the pages of the wizard, including defining how the plot should appear and any waveforms that you wish to add to the plot upon its creation. After clicking Finish, the new plot will be added below the last existing plot in the chart.
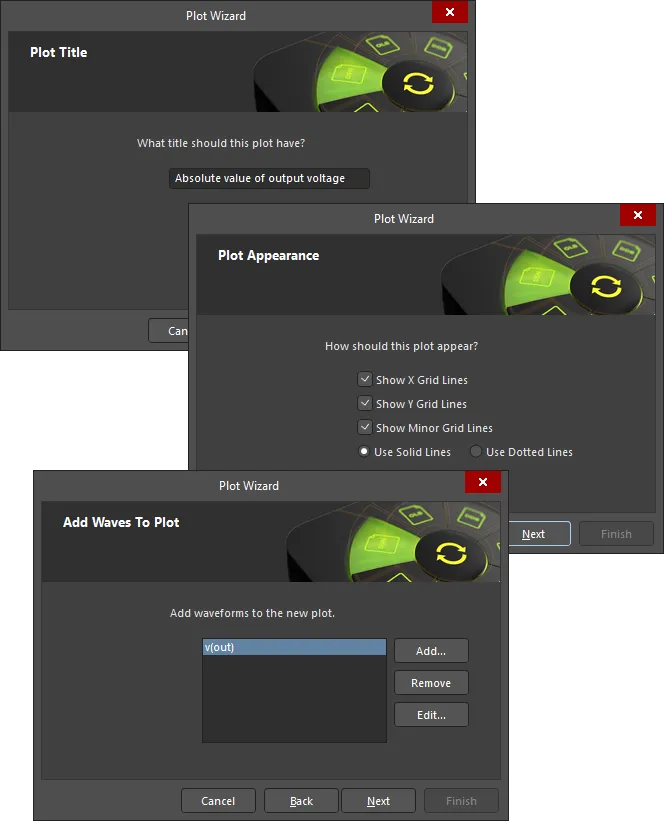
The Plot Wizard
Waveforms can also be added to a plot after its creation. First, ensure that the wave plot to which you want to add the waveform(s) is made active. Select the waveform(s) you want to add in the Source Data region of the Sim Data panel. Multiple waveforms can be selected using the standard multi-select features (Ctrl+Click, Shift+Click, and click-and-drag). Once the required waveform(s) is selected, click the Add Wave to Plot button. The waveform(s) will be added to the wave plot accordingly.

Required waveforms can be added to the active plot using the Sim Data panel.
Alternatively, use the Wave » Add Wave command from the main menus or right-click within the plot area and select the Add Wave To Plot command from the context menu to access the Add Wave to Plot dialog where you can select a waveform to be plotted and define a mathematical expression if required. The dialog shares the same controls as the Add Output Expression dialog used when adding output expressions via the Simulation Dashboard panel.
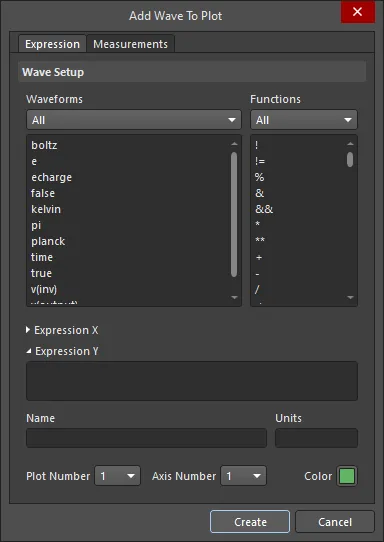
The Add Wave to Plot dialog
Formatting a Plot
The properties of an existing plot can be changed using the Plot Options dialog accessed by double-clicking within a plot area in the design space, by right-clicking a plot and selecting the Plot Options command from the context menu, or, for the active plot, selecting the Plot » Plot Options command from the main menus. From this dialog, you can change the plot's title and representation of the grid in that plot.
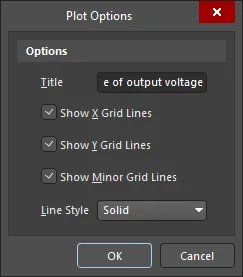
The Plot Options dialog
Copying Charts and Plots
As mentioned, the quickest way to add a plot to a new (or existing) chart is to copy an existing one. Ensure that the plot you wish to copy is made active in the current chart and use the Edit » Copy command from the main menus (shortcut: Ctrl+C). It is important that a constituent waveform not be selected prior to the copy, otherwise, you will copy the waveform instead.
When copying a plot, both the plot and its constituent waveform(s) will be included in the copy.
The plot can be pasted (Ctrl+V) into the same chart, a different chart of the same SDF file, or a chart of a completely different SDF file. When pasted, the plot will be inserted after the last plot in the chart. A copied plot can only be pasted once.
A chart itself can be copied to the Windows clipboard, for use in other applications. Ensure that the chart you want to copy is active in the design space and choose Tools » Copy to Clipboard from the main menus.
If a chart contains purely textual information, such as that for an Operating Point analysis, the information itself (rather than the whole chart display) can be copied to the clipboard, using the Tools » Copy to Clipboard as Text command.
-
Use the Edit » Cut command (shortcuts: Ctrl+X, Shift+Delete) to clear the active plot from the design space and copy it to the SimData editor's clipboard.
-
Altium Designer does not use the Windows clipboard for normal cut/copy operations in *.sdf documents. Instead, a separate internal clipboard is maintained for this document type. Also, the internal SimData editor clipboard is entirely independent of the internal clipboards used by the other editors. You can only cut/copy and paste between or within *.sdf documents.
Deleting Charts and Plots
To delete a chart, ensure it is the active chart in the design space and either use the Chart » Delete Chart command, or right-click on the chart's tab and choose Delete Chart from the context menu.
To delete a plot, ensure it is the active plot in the current chart and either use the Plot » Delete Plot command, or right-click within the plot and choose Delete Plot from the context menu. Alternatively, make the plot active, ensure no waveform for it is selected, then select the Edit » Delete command from the main menus.
If you want to leave the plot intact, deleting only the waveforms contained therein, use the Edit » Clear command instead.
Editing and Formatting a Waveform
As part of the analysis of your design, you may want to perform a mathematical operation on one or more of the analysis signals and view the resultant waveform. To edit a waveform, right-click on its name and choose Edit Wave (or select the waveform and choose Wave » Edit Wave from the main menus). The Edit Waveform dialog will appear. The dialog shares the same controls as the Add Output Expression dialog used when adding output expressions via the Simulation Dashboard panel.
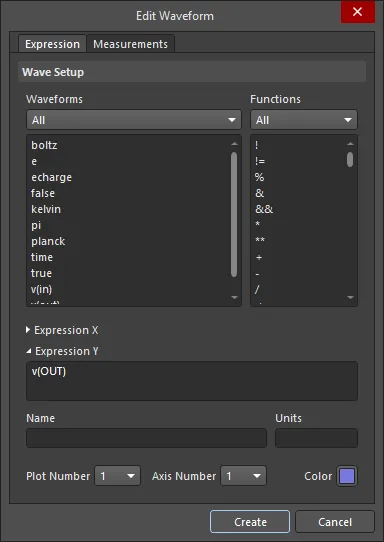
The Edit Waveform dialog
While you can define waveform colors individually using the Edit Waveform dialog, the Modify Wave Colors dialog accessed by choosing the Tools » Brightness command from the main menus allows you to change the color brightness of all waveforms in the currently active chart. The dialog essentially contains three buttons, allowing you to lighten the colors of all waveforms in the chart, darken the colors, or reassign the original color depths. Clicking the buttons will cause the waveform colors to change so that you can experiment with color depths. Actual change is not effected until clicking OK.
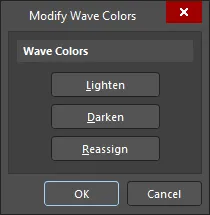
The Modify Wave Colors dialog
Creating a New Waveform
As well as source data waveforms generated as a result of running an analysis, you also have the opportunity to create your own waveforms. Access to the waveform creation feature is made through the Source Data dialog accessed from the main menus (Chart » Source Data) or by clicking the Source Data button on the Sim Data panel.
Once you have the Source Data dialog open, click the Create button. The Create Source Waveform dialog will appear. From this dialog, you can create:
-
A user-defined waveform based on entry of a set of data points, with each point defined using an XY value pair.
-
A sinusoidal-based waveform
-
A pulse-based waveform

Use the Create Source Waveform dialog to define a custom waveform.
Once you have finished defining the new waveform as required, give it a meaningful name and click OK – it will be added to the list of source data waveforms.
User-defined waveforms (i.e. those not generated through circuit analysis) can be edited at any stage, with respect to their characteristics. Select the waveform's entry in the list and click the Edit button.
Storing and Recalling Waveforms
The SimData editor provides the ability to store and recall waveform source data. Access to the storage feature can be made in two ways:
-
Directly from the design space. Select the waveform you wish to store and choose Tools » Store Waveform from the main menus.
-
From the Source Data dialog (Chart » Source Data). Select the waveform you wish to store from the list and click the Store button.
The waveform will be stored in an ASCII file (*.wdf) as a set of data points, with each point being represented by an XY value pair. Use the subsequent Store Selected Waveform dialog to nominate where, and under what name, you want the file saved. By default, the file will be named using the actual name of the waveform (i.e. WaveformName.wdf).
Recalling a waveform that has been previously stored can also be performed in two ways:

Use the Source Data dialog to store and recall waveforms.
Use the subsequent Recall Stored Waveform dialog to browse to and open the required WDF file. The waveform will be recalled and loaded into the source data list for the active chart. Note that once user-defined waveforms have been stored and recalled, they can no longer be edited.
If a waveform is recalled that possesses the same name as an existing waveform in the source data list, it will be given the suffix _1. Subsequent recall of the same waveform will result in waveforms appearing in the list with incremented suffixes (_2, _3, etc).
Copying Waveforms
A waveform can be readily copied and pasted using the standard Ctrl+C and Ctrl+V shortcuts (or Edit » Copy and Edit » Paste commands from the main menus) respectively. Ensure that the waveform is selected before copying.
The waveform can be pasted into a plot of the same chart, a plot of a different chart in the same SDF file, or a plot in a chart of a completely different SDF file. When pasting, ensure that the target plot is currently the active plot in the chart. The recipient plot can be empty or it can contain one or more existing waveforms. A copied waveform can only be pasted once.
After pasting a copied waveform, you can move it to a different plot as required. If you want to move the waveform to its own plot and there is no empty plot existing in the chart, change the view mode to show All plots visible (from the Document Options dialog), then drag the waveform to a point beyond the last plot in the chart – a new plot will automatically be added.
-
If pasting between charts, the pasted waveform may, at first sight, look incorrect. This may be due to the time base (X-axis) being different between source and destination charts.
-
Use the Edit » Cut command (shortcuts: Ctrl+X, Shift+Delete) to clear the selected waveform from the design space and copy it to the SimData editor's clipboard.
-
Altium Designer does not use the Windows clipboard for normal cut/copy operations in *.sdf documents. Instead, a separate internal clipboard is maintained for this document type. Also, the internal SimData editor clipboard is entirely independent of the internal clipboards used by the other editors. You can only cut/copy and paste between or within *.sdf documents.
Deleting Waveforms
To delete a waveform from a plot, ensure it is selected and either use the Wave » Remove Wave or Edit » Delete command, or right-click on the waveform's name and choose Remove Wave from the menu that appears. Alternatively, select the waveform and press the Delete key.
Deleting a waveform this way only removes that waveform from the design space, though. The captured data for the waveform is not deleted. The waveform remains listed as part of the available source data for the active chart. Permanent removal of waveforms is carried out from the Source Data dialog. Access this dialog from the main menus (Chart » Source Data) or by clicking the Source Data button in the Sim Data panel. To permanently delete a waveform, select its name in the list and click on the Delete button. Multiple waveforms may be selected for deletion using the standard Ctrl+Click, Shift+Click and click-and-drag features.
To bring back a waveform that has been deleted in this fashion, you would either need to recall a stored copy of it (from a *.wdf file), or re-run the analysis.
Exporting Charts, Plots and Waveforms
Commands available on the File » Export sub-menu allow you to export the active chart, the active plot or the selected waveform into comma-separated value (*.csv) format. In either case, the Export Data dialog will appear to define export options as required.
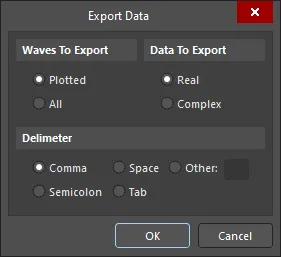
The Export Data dialog
If you are exporting the active plot (File » Export » Plot), all waveforms contained within that plot will be exported. If you are exporting the selected waveform (File » Export » Waveform), only the selected waveform will be exported. You can control whether Real or Complex data is exported, and specify the delimiter to be used (comma by default).
If you are exporting the active chart (File » Export » Chart), the Waves To Export region of the dialog will also be available. You have the choice of exporting only data for those waveforms currently displayed in the chart, or all waveforms for which source data is available. The latter can include signal data captured from the analyzed circuit, as well as user-defined waveforms. The Source Data region of the Sim Data panel lists all waveforms for which there is available (stored) data.
After defining export options, specify where you wish the exported file to be saved, using the Export Selected Waveforms dialog.
The exported file contains each signal waveform stored as a set of data points comprising an X-axis (time) value and a Y-axis (data) value.
Importing Waveforms
Waveform data stored in comma-separated value format (*.csv) can be easily imported into the active chart. This allows you to quickly import data that has been previously exported, or to import waveform data that has been generated from a third-party application - as long as it has been stored in CSV format.
Before importing, first ensure that the chart you wish to import into is made active in the design space. Access the import feature by running the File » Import command. Use the subsequent dialog that appears to browse to and open, the required CSV file. The remaining steps of the import are all carried out using the Import Data Wizard. Follow the pages of the wizard – upon clicking Finish, the waveforms will be imported into the active chart and added to that chart's source data list.
If the Wizard detects any existing waveforms available for use in the active chart whose names are the same as those to be imported, the Invalid Waveforms page will open. Invalid waveforms will not be imported. To import a waveform in the file, you must rename it. Click on the name field and change the name accordingly. The waveform will then be moved to the Valid Waveforms region.
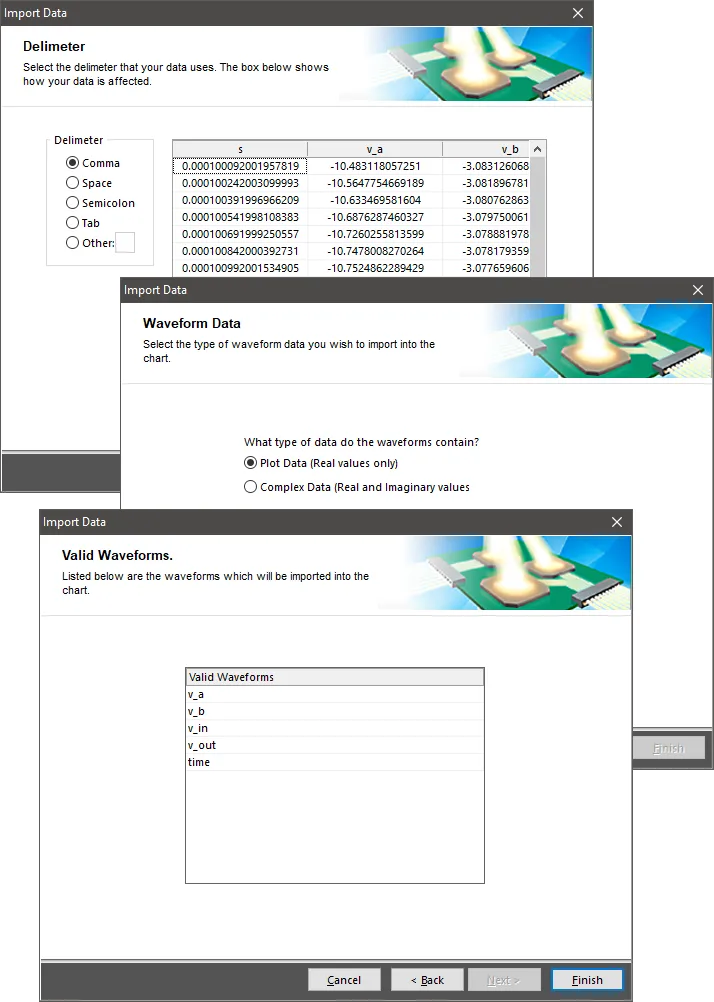
The Import Data wizard
If any of the waveforms being imported have names matching those already existent for the recipient chart, the wizard will alert you to this fact, listing the offending waveforms, and asking for you to rename the imported version of those signals. Click directly on a name in the wizard to edit it.
Identifying Waveforms on a Monocolor Print
With the ability to assign any color you want to a waveform, display of multiple waveforms within the same plot is kept manageable when viewing results and distinguishing between waveforms in the SimData editor. However, if the results are printed in monochrome, color assignment, on the whole, becomes redundant.
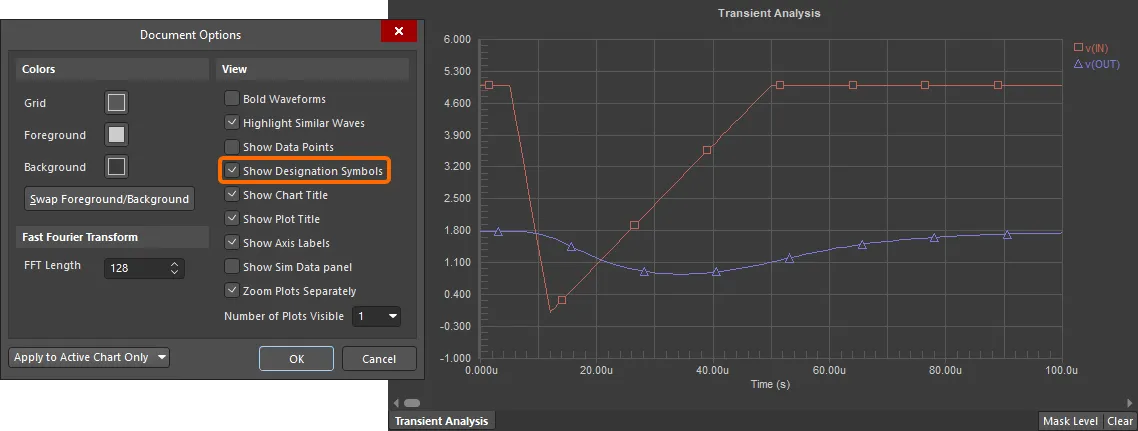
Use the Show Designation Symbols option to distinguish between waveforms on the same plot using individual symbols.
To make each waveform on a single color printout easily identifiable, the editor provides a feature to add identifier symbols to each waveform. To display these symbols, enable the Show Designation Symbols option in the Document Options dialog. If the waveforms are displayed in individual plots, then a square symbol will be used for each. If two or more waveforms are displayed within the same plot, then a different shape is used for each.
Printing Analysis Results
Printing your analysis results is a case of following these steps:
-
Ensure the chart from which you wish to print results is active in the main analysis window. That can be a chart containing data of any type, including graphical, textual, or stress analysis data.
-
Setup the page properties
-
Setup the printer
-
Preview the print (optional)
-
Print
Although there are various commands available from the main File menu for these steps, you can access all required setup dialogs from the SimView Print Properties dialog (File » Page Setup).

The SimView Print Properties dialog
Use this dialog to set paper size, scaling and the output color for the print.
Click the Printer Setup button to access the Printer Configuration for dialog – a standard dialog for choosing the device you want to print to and setting related properties accordingly.
Click the Advanced button in the SimView Print Properties dialog to access the Wave Print Properties Form dialog. Use this dialog to choose which plots in the chart are to be printed, which waveforms within those plots should be printed, and how page numbering should appear. You can also specify which measurement data to be included in the printout. Print cursor-based measurement data will only be available if you have enabled cursors in your chart. The actual measurement types depend on how the cursors have been assigned (see the Cursor-based Measurements section). Use the options at the bottom of the dialog to specify if you would like to include other document elements: chart title, plot title, etc.

The Wave Print Properties Form dialog
Clicking the Preview button in the SimView Print Properties dialog will load the data to be printed into the Preview SimView Prints dialog. Use this dialog to browse through the information you have requested to print.
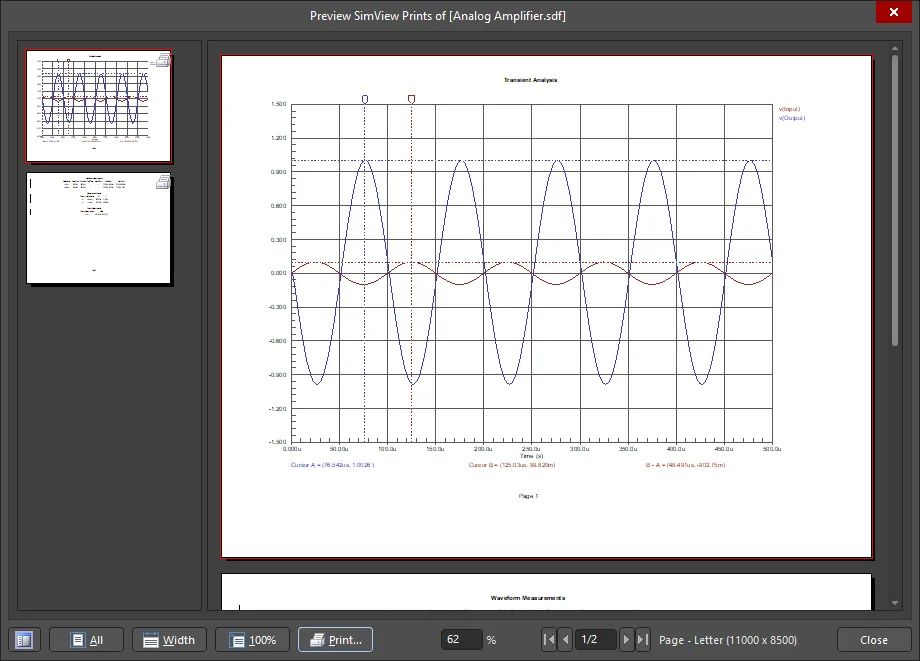
The Preview SimView Prints dialog
When you are satisfied that the prints are as required, run the Print command – either from the Preview SimView Prints dialog, the File menu, or the SimView Print Properties dialog.
Working with Textual Data
The charts created for Operating Point and Transfer Function analysis types will not contain plots and/or waveforms – these charts display textual data. In this case, a 'waveform' represents a single calculated value. Add the required values to the chart by selecting the corresponding entry in the Source Data list in the Sim Data panel and clicking the Add Wave to Plot button.

An example of adding a calculated value of a Transient Function analysis.
Textual information can be copied to the clipboard using the Tools » Copy to Clipboard as Text command from the main menus.
Working with Digital Plots
Digital plots represent the logical level in a digital node: 0 or 1. An example of a digital plot is shown below.
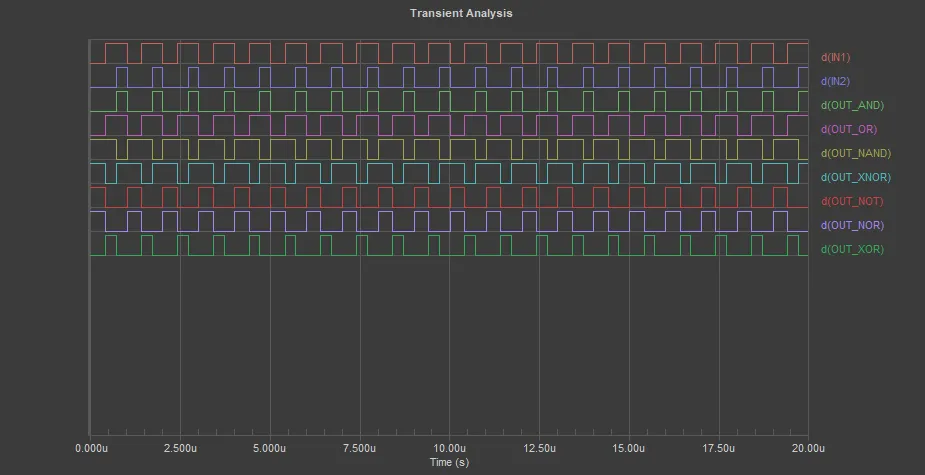
An example of a digital plot
Digital waveforms can also show the undefined and high-impedance states by using two- and three-line wave sections, respectively.


Undefined (first image) and high-impedance (second image) states shown on a digital plot.
Note that measurement cursors represent undefined and high-impedance states as 'X' and 'Z', respectively.
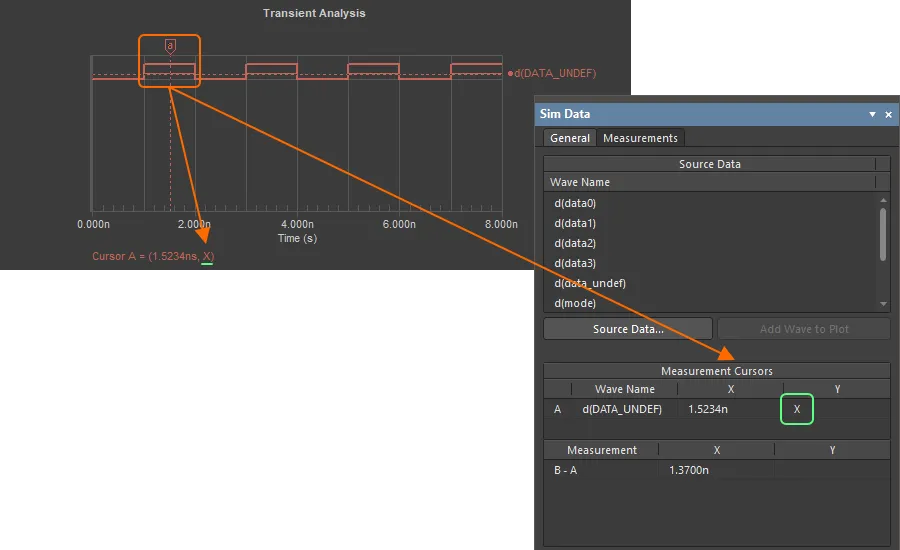

Representation of undefined and high-impedance states by measurement cursors.
-
Digital plots have no Y-axis since only digital levels are shown for digital waves. Also, note that digital and analog waves cannot be mixed in a single plot.
-
Boolean functions can be applied to digital waves. The resulting waves will still be digital, i.e. they will be shown on a digital plot. Other operations will convert the resulting wave into an analog wave.
Working with Measurement Results
The result data of measurements are displayed on the Measurements tab of the Sim Data panel when exploring the simulation result document.
There are a number of features to assist you in analyzing the simulation measurement results. The features include:
-
Select a measurement value and click the Show on chart button to display the measurement cursors on the plot highlighting the region for which the measurement has been calculated. Learn more about Cursors-based Measurements.

Use the Show on chart button to visualize the measurement.
-
Click the Add button to access the Add Waves to Plot dialog where a new waveform and measurements for it can be defined.
-
Click the
 button to access the Edit Waveform dialog where an existing waveform and the currently defined measurement can be edited; no need to return to the Simulation Dashboard panel.
When the simulation result document includes waveforms for multiple passes of the analysis (e.g, when performing a temperature sweep or Monte Carlo analysis), there will be a measurement value for each waveform. In this case, a table of measurements will be presented on the Measurements tab of the Sim Data panel, and the following features are accessible:
-
Measurement statistics are calculated automatically and displayed in the lower region of the Sim Data panel.
-
A full table of the measurement results can be displayed by clicking the Expand the table control in the Sim Data panel. The table will be shown in the Measurement Table chart. The data in the table can be selected and copied (e.g., to paste it to a spreadsheet).
-
Generate a plot using the Plot button. For example, if a parametric sweep has been performed, you can create a plot of the measurement values against the swept parameter. The plot will be added to the Measurement Plot chart.
-
Visualize the distribution of data by generating a histogram using the Histogram button. The histogram will be added to the Measurement Histogram chart.
Taking Direct Measurements
The SimData editor provides features for obtaining measurement information directly within the design space. Base measurements are automatically presented for a selected waveform. If you want to take more precise measurements, dedicated measurement cursors are available – enabling you to take measurements in a more interactive way.
Measurements for a Selected Waveform
General measurements for a selected waveform are presented in the Waveform Measurements region of the Sim Data panel.

General measurements for a selected waveform.
Data is calculated from the waveform itself and does not involve the measurement cursors in any way. The following data is calculated:
| Rise Time |
The time taken by the signal to change from 10% to 90% of the difference between Top Line and Base Line values. Measurement data is only available when the selected signal is power-based (mixed-signal simulation) or is a resultant waveform of a signal integrity analysis. |
| Fall Time |
The time taken by the signal to change from 90% to 10% of the difference between Top Line and Base Line values. Measurement data is only available when the selected signal is power-based (mixed-signal simulation) or is a resultant waveform of a signal integrity analysis. |
| Min |
The minimum value reached by the waveform. The X-axis value at which this point occurs is also displayed. |
| Max |
The maximum value reached by the waveform. The X-axis value at which this point occurs is also displayed. |
| Base Line |
The steady state value for the low level of the signal waveform. This value is most noticeable, graphically, for a signal integrity-based analysis waveform, where ringing of the signal occurs about this base line value (undershoot). |
| Top Line |
The steady state value for the high level of the signal waveform. This value is most noticeable, graphically, for a signal integrity-based analysis waveform, where ringing of the signal occurs about this top line value (overshoot). |
Cursor-based Measurements
Precise data measurements can be taken by using the SimData editor's dedicated measurement cursors. Two cursors are available – Cursor A and Cursor B – which can be added to the same or different waveforms in the design space.
A cursor (A or B) can only be used once in the active chart. If you choose to assign a cursor to a waveform and another waveform is already using that cursor, the cursor will be reassigned to the new one.
Addition of a measurement cursor can be made in one of two ways:
-
Select the waveform and use the Wave » Cursor A or Wave » Cursor B command.
-
Right-click on the waveform's name and choose Cursor A or Cursor B from the context menu.
An added cursor will appear as a tab at the top of the plot in which the waveform resides, and will assume the same color as the waveform to which it is assigned. Crosshairs appear within the plot, intersecting the waveform. Move the cursor by clicking and dragging its tab.
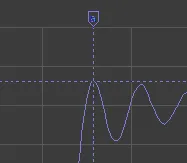
Cursor's intersection and tab
As you move the mouse pointer over the area of a plot, the XY value pair is shown at the far left of the Status bar.
Measurement data is available in the Measurement Cursors region of the Sim Data panel. You can also enable display of measurement data within the design space. This is done from the Cursors tab of the Chart Options dialog (Chart » Chart Options).
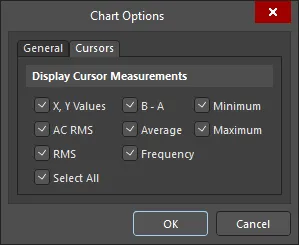
The Cursors tab of the Chart Options dialog
The availability of cursor measurements – both in the design space and on the Sim Data panel – depends on how the measurement cursors have been assigned:
-
If a single cursor is being used, you can read just the XY values of the cursors' intersect point.
-
If the two cursors have been added, to different waveforms, you can measure:
-
If the two cursors have been added, to the same waveform, you can measure:
-
XY values
-
B-A
-
Minimum A..B
-
Maximum A..B
-
Average A..B
-
AC RMS A..B
-
RMS A..B
-
Frequency A..B
Select the cursor by clicking on its tab to gain access to a range of commands on the main Wave menu that operate on the cursor. You can move it to the maximum or minimum point on the waveform or quickly jump to the next/previous peak/trough.
To remove a cursor, use the Wave » Cursor A or Wave » Cursor B command from the main menu or right-click the cursor tab and select the Cursor Off command from the context menu.
Cross Probing to the Schematic
The SimData editor offers the ability to cross-probe from the selected waveform to the corresponding analysis node in the circuit from which the results for that waveform were captured.
To use this feature, right-click on the name of a waveform in the design space and choose Cross Probe to Schematic from the pop-up menu that appears. The source schematic document will be made active and the corresponding node highlighted – in accordance with the Highlight Methods defined on the System – Navigation page of the Preferences dialog.
You can only cross-probe from waveforms for which data was captured through analysis of the schematic circuit. If you have edited a source waveform by applying a mathematical expression to it, or if you have created a new waveform, you will not be able to cross-probe.